BostonCIO’s Graphical System Visualization™ (GSV) is a set of mapping techniques that yield visualization diagrams promoting a common understanding of systems and processes for the most technical users up to and including executive leadership and boards seeking to understand information technology designs, capabilities, architectures, and risks and opportunities.
The goal of the GSV is to present the entire business mapped over the applications and technical infrastructure – all on a single sheet of paper. The test of a good GSV project is the “ah-ha” moment when senior executives, board members, investors and line managers finally see a fully contextual presentation of their business and technology.
We get that ah-ha moment every time.
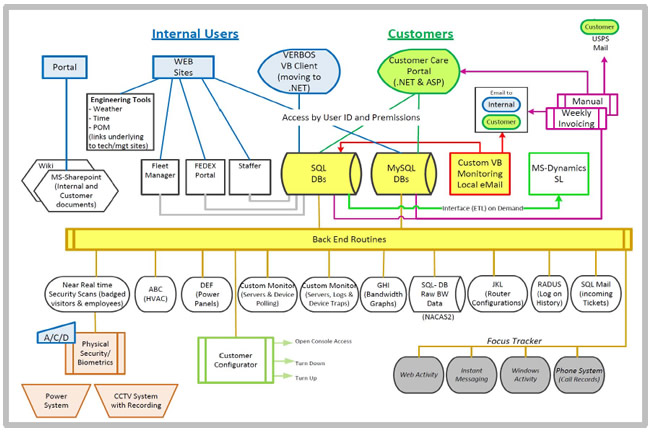
This systems architecture focused GSV – Graphical System Visualization™ example is one that might be developed as part of a technical due diligence. While this was extremely valuable for the private equity investors in understanding the application architecture, the most remarkable reaction came from the Lead Developer. He commented, “This puts 15 years of my development into an easy to understand one page view. It can take me weeks to explain how all these bits relate to each other and now I can just hand them this visualization.”

- Blue highlights the internal user view
- Green calls out the customer-centric view
- Architectural Element Mapping illustrates the relationship of various software components and their underlying technologies
- Purple and Green call out the Financial Systems and their connection points
- Yellow identifies high risk areas where developing documentation is recommended
- Hallmark of GSV is an inconsistent threshold of detail. By not adhering to a predefined level of detail to include, the GSV can provide details were necessary for the audience to gain a true understanding of the subject and the relationships
- Olive and Brown objects explain the relationship of underlying INTERFACED system to the overall architecture
- White and grey objects explain the relationship of underlying INTEGRATED system to the overall architecture
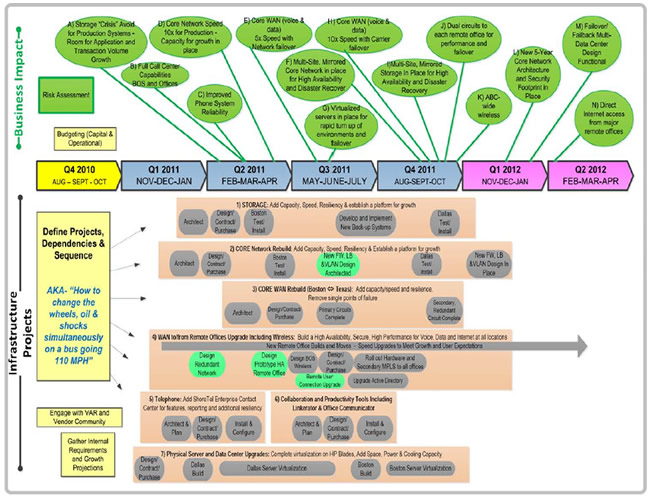
This project roadmap focused GSV – Graphical System Visualization™ was developed for an engagement where the client was committing to many separate improvements as part of a multi-million dollar infrastructure stabilization and improvement project. Given the cost and resource commitment, it was important for executive management to grasp the interrelated nature of the project, milestones and business benefits all against a consolidated time line. The CFO commented, “this is the first time I have ever truly understood how all the bits and bytes relate to project, budget and benefits.”

- These green balloons show the detail and timing of the business benefits of the infrastructure spending
- Tie everything to calendar and fiscal budgeting quarters
- High level capture of the projects with Milestones:
- Tie out to projects defined and funded in the capital budget
- Timephases the major milestones within projects
- Green project milestones call out items with their own visualizations
GET IN TOUCH
Interested in learning more about GSV or our other tools: Big Block Project Management™ and Shared-Basis CIO℠ ? We’d love to talk with you about them.
Email us or call (508) 597-2716.